The goal of this study was to relate olive trees productivity and remote sensing data.
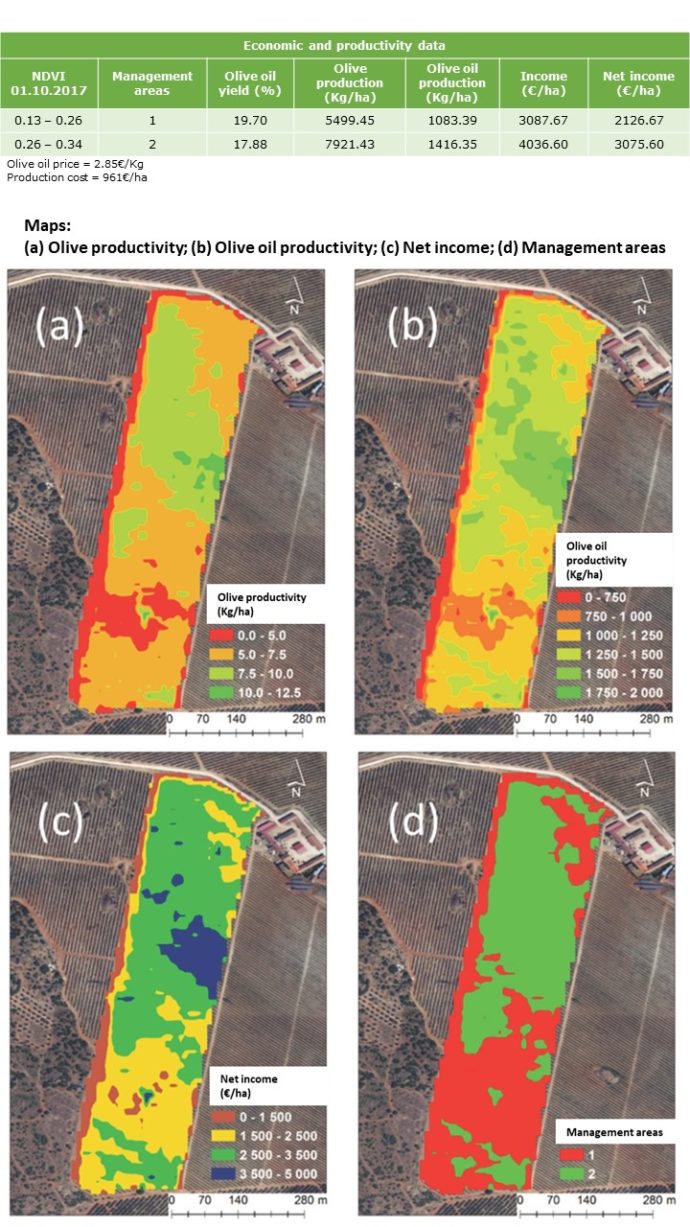
Analysing the NVDI values obtained from Sentinel 2 data in an olive grove (see the table in the Figure), two management areas were defined based upon those values: i) one area with higher vigour and ii) another area with less vigour (Figure map (d), 1 is lower and 2 is higher vigour).
For each management area, the olive production from a sample of 20 trees was measured and transformed into olive oil. The obtained data were adjusted to tree density in the plot.
Despite the higher oil yield in area 1, with lower productivity, when compared with area 2, of higher productivity (Table in the Figure) the difference in production in area 2 when compared to area 1 greatly compensates for this difference in performance in terms of olive oil. In short, it is better to produce more with less oil yield than producing less with higher oil yields.
Although the difference in the productivity of olives and oils (Figure table and maps (a) and (b)) is very impressive, because we are talking about a plot that is treated uniformly, the difference in net income of the plot (Figure table and map (c)) impresses even more. We can find differences within the plot of around 1000 €/ha (Figure map (c)) and such differences show that the production system will have to be rethought to optimize processes and reduce the impacts associated with environmental concerns.
There are only two ways to optimize the system, either to increase productivity or to reduce costs. In this case, the increase in productivity would have to go through differentiated irrigation, because the limiting factors are water and soil. However, in this farm water is a scarce factor so, this does not seem to be an option.
Therefore, it is necessary to reduce the costs associated with the production area 1 to increase net income in this area and increase the overall result of the activity, reducing associated environmental impacts.
In summary, small differences in NDVI at the plot level can mean large differences in yield. This example reveals that, within the same plot, we may have 2000 €/ha of difference in terms of net income. As such, there is a need to evaluate all plots to understand how to optimize the production process by differentiation in treatment, either by increasing productivity or by reducing costs.
References
Marques Da Silva, José & Terrón, Jose María & Domínguez, Francisco & Paixão, Luís & Sousa, AdÉlia & Silva, Luis & Baptista, F. & Serrano, João & Gonçalves, Ana & González Ramiro, Abel & Marques, Francisco. (2020). MANUAL OF GOOD AGRICULTURAL PRACTICES – PRECISION AGRICULTURE WITH SATELLITE IMAGES.