Productivity is the decisive test of any economic activity. In Precision Agriculture it’s important to know how much we produce, however, it is more important to know where we produce more and where we produce less to optimize resources management.
Yield maps are known for many years but in the early twenty-first century, it was rare to find a harvester with a yield monitor. Today, it is rare to find one without it. Yield maps become popular in recent years but farmers still do not take advantage of them: they often suspect that the information may not be correct and they feel powerless to modify processes (irrigation system, soil type, etc.).
Although processes cannot be easily changed, we must be aware of the limitations of our plots and understand if small changes can benefit efficiency. Productivity is just the result of integrating several factors, such as soil, water and plants but also pests and diseases, climate, etc. The agriculture game is played by optimally combining all these factors, which is often a difficult balance.
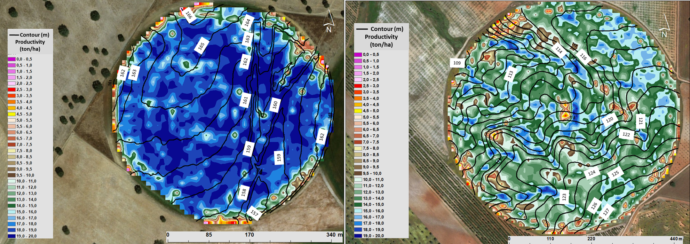
The Figure shows the yield maps of two plots. Both belong to the same farmer and had the same technical itinerary. The left plot, in addition to higher productivity, is more uniform than the one on the right. What is wrong with the soil-water-plant interactions of the plot in the right? What can be done? Without the yield maps, we do not know the spatial variability of productivity, and we cannot study which phenomena are conditioning the performance of the plot.
Analyzing the yield maps with the contours, the plot with greater productive limitations presents higher yields in the depression areas. There might be a water infiltration problem in the more elevated areas leading to water runoff (surface drainage lines) which benefits the plants in depression areas.
Without the yield map, we would hardly realize that the problem seems to be associated with water distribution and that can be solved by creating surface depressions to increase water infiltration. The problem and the solution may even be other but we can only find solutions if we can recognize problems and without the yield maps we will never be able to recognize them.
The productivity maps are fundamental to identify the limiting factors and to understand whether it is possible or not to optimize the production system.
Figure – Yield maps of two corn plots.

