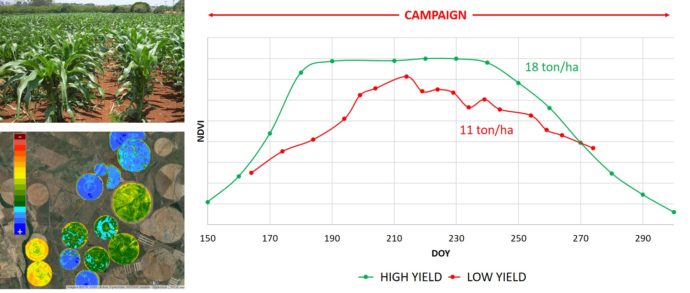
The figure shows some corn NDVI values in a map and a graphic of NDVI values along the crop cycle. We can ask, looking at the Figure, which plots were more environmentally efficient and more globally sustainable: the ones with chlorophyll curve represented in green or in red colour?
If the plots had the same technical itinerary, the profitability or return of each production factor (e.g., fertilizers) was higher where the productivity was higher (chlorophyll curve in green). From an environmental point of view, we can say the same, that is, that most environmentally friendly plots are the most productive ones, because they make better use of the production factors, reducing their likelihood of causing diffuse pollution.
Let’s illustrate with an example. Assuming that one puts 100 units of Nitrogen in all the plots in the same way, and the green one (Figure) produced 18 tons/ha and the red one (Figure) produced 11 tons/ha, which are the most efficient, from the environmental point of view? The plots that produced 18 tons/ha, since they will surely have extracted the 100 units of Nitrogen applied, while the less productive ones did not. This means that by not using completely or almost completely the nutrients that have been applied, latter they will contribute to a serious environmental problem. The unused nutrients will go into the aquifers, into the rivers and later to the sea and may thereby cause problems of diffuse pollution and eutrophication of water and/or soil.
In summary, the environmental impact of agriculture can never be associated with the maximum amount of nutrients placed in the plot, but only with the utilization ratio of these nutrients. Not always the most polluted plots are those where we put more nutrients. As long as the nutrients are used at its maximum, they may have a less environmental impact than the less productive parcels where the nutrients are not used to their maximum.
By using chlorophyll curves like the ones in the Figure, we can notice the greater or lesser agronomic performance of a particular crop/plot. Therefore, we may also have an indirect measure of their environmental performance since the better agronomic performance is, the better economic and environmental performance.
Figure – NDVI Corn agronomic performance.