Yield maps are fundamental to analyze soil/water/plant relationships and try to understand if it is possible to optimize the agronomic process to improve the performance of the system. However, agriculture is an economic activity so, despite the agronomic processes one must consider the economic return of the activity and if possible reduce risks and increase profits.
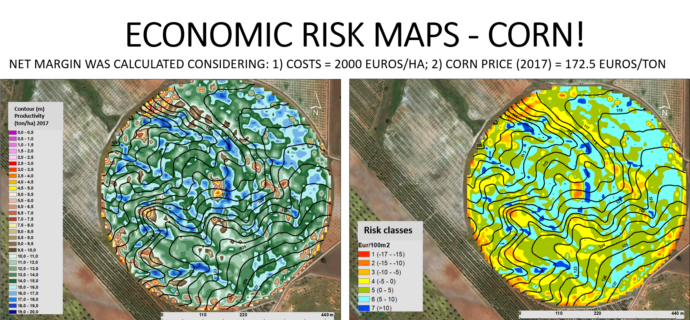
Considered the previous, the Figure presents a production map of a corn plot on the left side and an economic risk map for the same plot on the right side.
The economic risk map shows that between the red and yellow colors the farmer is losing money and between the green and blue colors he is making money. The farmer is losing money in approximately 20% of the plot area and because of that, he needs to compensate the losses having approximately another 20% of the plot area with a positive balance. In resume, approximately 40% of the plot area presents a zero economic balance. So why producing in all plot area? With these specific conditions, it would be the same if initially we cultivated only 60% of the plot.
Considering the risk map, if the price of corn falls, there is a great probability for the green colors to turn yellow, however, if the price falls and the costs rise at the same time the balance may be close to zero, and the work has no return.
How can we reduce the risk?
Fertilization is set assuming that we will achieve given productivity. Why are we treating in the same way the areas between the green and the blue and the areas between the red and the yellow (right in the map)? Surely the last ones are not limited by the amount of fertilizers, but by other factors, such as poor drainage. To reduce the economic risk, we can reduce the cost with fertilizers in the areas between red and yellow. We may even think that it is reasonable to increase the input of nutrients in the areas between green and blue, because here the lack of nutrients may be limiting the productivity potential. We can reduce the risk in two directions: i) reducing costs in areas where the fertilizer is not the limiting factor; and ii) increasing the incomes by increasing productivity in areas where the fertilizer can be a limiting factor.
Without any doubt, we will have to treat better the areas that are our bread and butter, therefore, we cannot reduce the production factors in the blue areas, on the contrary, we have to increase them. In the yellow and red areas, we can reduce the production factors, first because they produce less and do not need so many production factors and secondly because they are making losses.
If the farmer is aware of the economic risk map, he can better allocate their resources and thereby reduce the economic risk of the activity and at the same time the environmental impact associated with it.